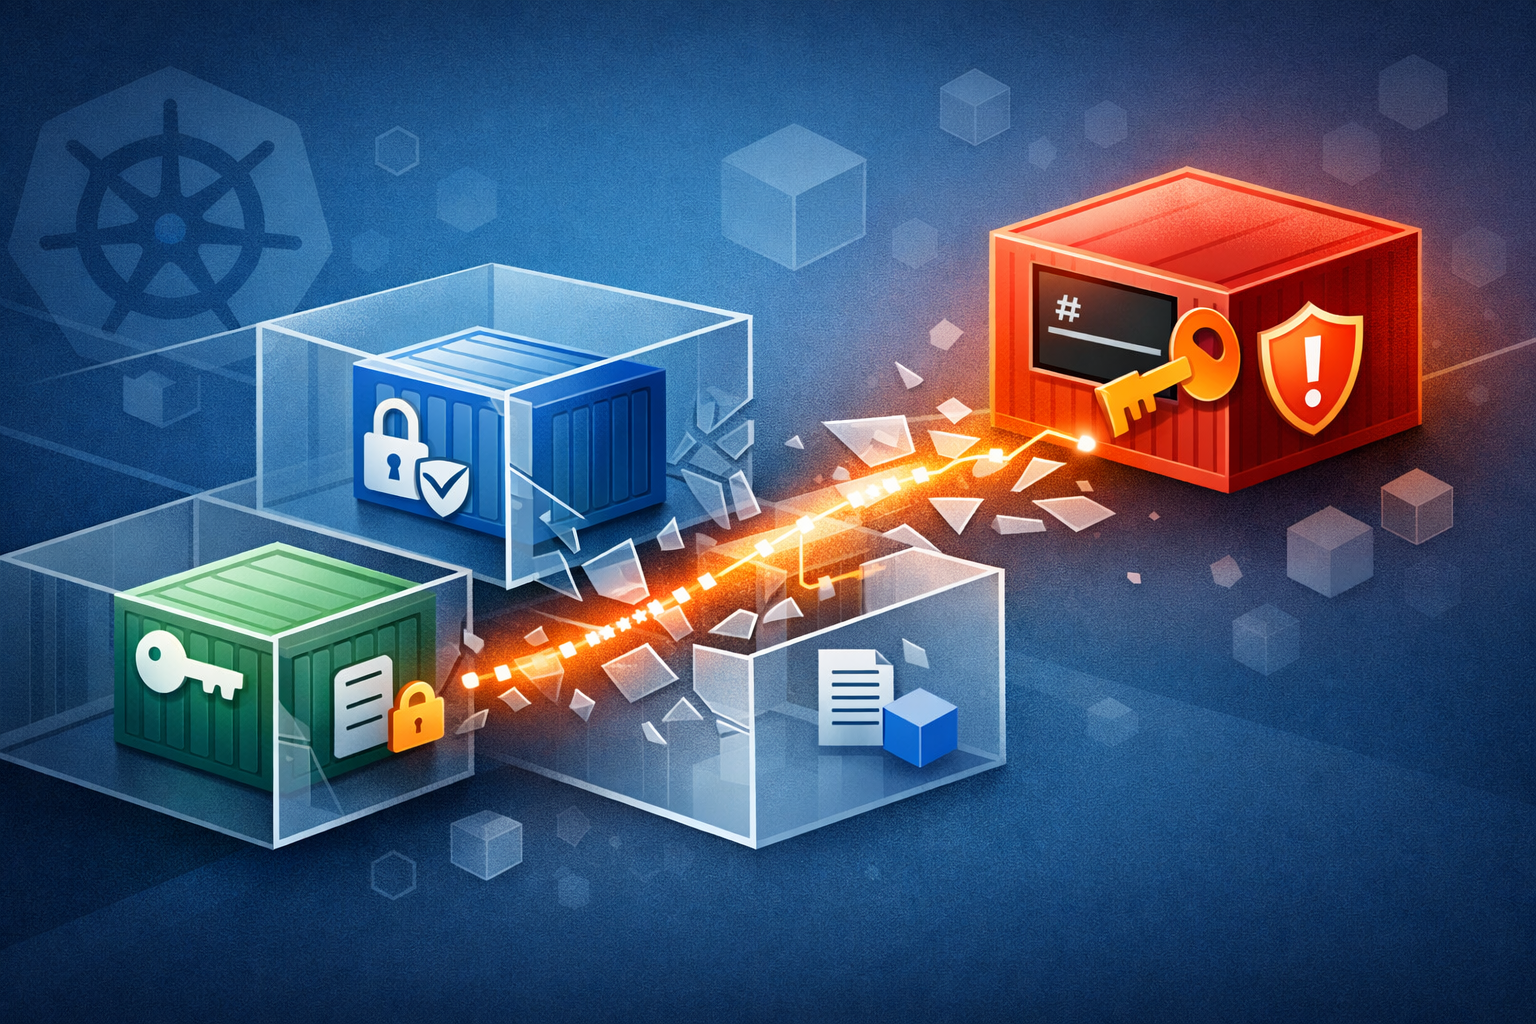
Balancing Cost Optimization and Security Boundaries
A while back, I was working with a team that wanted to consolidate their EKS clusters to save money. FinOps loved it, engineering approved it - made total sense from a cost perspective. But as we started mapping services to clusters, someone asked: “Can we run our payment API and our internal dashboard on the same nodes?”
That question led me down a rabbit hole that ended with me building a lab to see what actually happens when you mix sensitive workloads with debug tooling. Turns out, the answer is “it depends” - but it depends on things most teams don’t think about.
Here’s the - not so new - problem: not all workloads have the same security requirements. Your payment processing API probably needs PCI-DSS compliance. Your internal dashboarding tools most likely don’t. Can they share nodes? What about when you need to debug a production issue and deploy a privileged pod?
The challenge isn’t Kubernetes itself—it’s understanding what happens when privileged debug tooling meets namespace boundaries.
The Debug Tool Trade-off
Here’s a scenario that plays out in organizations every now and then:
- Production service crashes on Friday at 4 PM
- On-call engineer needs to inspect the core dump
- Standard logging doesn’t capture the memory state needed to diagnose the issue
- SRE team deploys a privileged debug DaemonSet to the cluster
- Problem gets solved, everyone goes offline or home
- The debug DaemonSet remains running for future incidents (by design or oversight)
This is a rational response to operational needs—debugging production issues often requires privileged access to process memory, kernel state, and system calls. The challenge is that these same powerful tools can access data across namespace boundaries.
From this privileged position, the debug pod can:
- See every process on the node (across all namespaces)
- Attach debuggers to any running container
- Extract secrets from process memory
- Modify kernel parameters affecting all pods
This creates a tension: operational velocity vs. security boundaries. Neither is wrong—they’re both valid organizational needs. The question is how to achieve both.
Why I Built This Lab
I wanted to see for myself what “privileged pod breaks namespace isolation” actually means in practice. I’d read about it in Kubernetes and container security docs, but reading about it and watching PASSWORD=SuperSecretDemo appear in my terminal from a different namespace are two very different experiences.
So I built a deliberately vulnerable lab environment to test the limits of namespace isolation. What I found confirmed what I had read and changed how I think about multi-tenant Kubernetes security.
What I’ll Show You
In this post, I’ll walk you through:
- How a debug pod in one namespace extracts secrets from another - you’ll see
PASSWORD=SuperSecretDemoappearing in my terminal from across the namespace boundary - Why
hostPID: truebreaks tenant isolation - and why this matters for compliance - The compliance implications for PCI-DSS, HIPAA, and SOC2 (with appropriate disclaimers - I’m not a lawyer or a QSA)
- A practical framework for deciding which services can colocate, or at least get the conversation started in your organization
This isn’t theoretical threat modeling. This is what actually happens when you run kubectl debug without thinking through the security implications. Let’s dive in!
Understanding Namespace Isolation (Or Lack Thereof)
Before I show you the lab demonstration, let’s talk about what namespace isolation actually means in Kubernetes.
Kubernetes namespaces provide logical separation, not security boundaries. Think of them as folders on a filesystem—helpful for organization, but not access control.
Here’s the problem: when you deploy a pod with these settings:
securityContext:
  privileged: true
  capabilities:
    add: ["SYS_PTRACE", "SYS_ADMIN"]
hostPID: true
You’ve just given that pod host-level access, regardless of which namespace it’s in or which namespaces it targets. Here’s what that means in practice:
The Three High-Risk Permissions
1. hostPID: true - See All Processes
This setting shares the host’s process namespace with the container. When enabled, the container can run ps aux and see every process on the node, including:
- Processes from other namespaces
- System processes
- The kubelet itself
A debug pod in the kube-system namespace can see and interact with application processes in your production namespace. Namespace boundaries mean nothing once you have host PID access.
2. SYS_PTRACE - Attach to Any Process
The SYS_PTRACE capability allows using debuggers like gdb or strace. This means:
- Attaching to any process in other namespaces
- Dumping process memory to disk
- Inspecting variables, heap, and stack
- Reading secrets from memory
Combined with hostPID, you can attach a debugger to any running container on the node and extract whatever’s in its memory.
3. SYS_ADMIN - Modify Kernel Parameters
With SYS_ADMIN, you can modify kernel settings using sysctl. These changes affect the entire node, not just your container.
For example, changing the core dump pattern with sysctl -w kernel.core_pattern=/tmp/core.%e.%p forces every process on the node to dump cores to /tmp where your debug pod can access them - including processes in other namespaces.
These three permissions together create a perfect storm: see all processes, attach debuggers to them, and force them to dump their memory.
Before I show you the lab demonstration, it’s important to understand that not all workloads need the same level of protection from this risk. Let me give you a framework for thinking about which services can safely colocate.
A Practical Service Classification Framework
Not every workload requires the same level of isolation. Here’s a risk-based framework for making colocation decisions:
Tier 1: Critical/Sensitive Services (Isolation Required)
This is anything that handles payment card data, healthcare records (PHI), cryptographic keys, or forms the core data plane of a multi-tenant SaaS. If losing this data would trigger mandatory breach notifications or regulatory fines, it’s Tier 1.
For these services, I recommend dedicated EKS clusters or at minimum, dedicated node pools with strict network isolation. Don’t run privileged debug pods on these nodes - I know it’s inconvenient, but the compliance risk almost always outweighs the operational convenience. If you absolutely must debug, use sanitized replicas in non-production with data masking.
Enforce the restricted Pod Security Standard, use external secret managers (AWS Secrets Manager, Vault), implement deny-all network policies with explicit allowlisting, and log everything. Yes, this is expensive. But if you process card payments, losing PCI compliance probably costs far more.
“Can’t I just harden the pods instead of separating them?”
I get this question a lot. If you drop all capabilities, disable hostPID and hostNetwork, run rootless containers, and enforce Pod Security Standards - isn’t that good enough to colocate Tier 1 services?
What hardening prevents:
- Cross-namespace process visibility (no hostPID)
- Privilege escalation via capabilities
- Many common container escape vectors
- Direct network attacks (with proper network policies)
What hardening doesn’t prevent:
- Container runtime or kernel exploits (remember runc CVE-2019-5736?)
- Side-channel attacks (CPU cache timing, Spectre/Meltdown variants)
- Resource exhaustion affecting neighbors on the same node
- Compliance scope complexity (your auditor may consider the entire node group in scope)
My take on Tier 1 colocation:
- Same org, same compliance scope (e.g., your payment API + fraud detection): Probably acceptable with full hardening
- Multi-tenant SaaS (Customer A’s data + Customer B’s data): I wouldn’t do it, even with perfect hardening - the blast radius is too high
- Different compliance scopes (PHI + PCI data): Avoid it - you’ve just made both audits more complex
Hardening reduces risk significantly, but for true Tier 1 isolation, I still recommend separate node pools or clusters. Defense in depth matters, especially when the cost of being wrong is a compliance failure.
Tier 2: Moderate Sensitivity (Enhanced Controls)
These are internal microservices with service-to-service authentication, observability infrastructure handling sensitive logs, services processing encrypted customer data, or session management. Important, but not immediately catastrophic if compromised.
I’d recommend dedicated node pools (using taints/tolerations) and enforce at least the baseline Pod Security Standard. Use external secret management and disable core dumps with ulimit -c 0. If you need to debug, use ephemeral containers with time limits (1 hour max), require approval workflows, and audit everything.
Can you share nodes with Tier 3? Yes. With Tier 1? No.
Tier 3: Low Sensitivity (Safe to Colocate)
Public-facing APIs that don’t process sensitive data, internal tools, dashboards, CI/CD runners (with proper secret management), static content, and dev/staging environments. If compromised, the blast radius is limited.
Standard RBAC, network policies, and the baseline Pod Security Standard are sufficient here. Debug tooling is acceptable - you can even run debug DaemonSets if needed, just audit who’s using them. These services can freely share nodes with each other.
Seeing It For Myself: The Attack Demonstration
Alright, let’s get hands-on. I wanted to see exactly what a debug pod could actually do, so I built a deliberately vulnerable lab environment. Everything I’m about to show you is from my actual AWS account - real commands, real output.
Don’t try this in a production environment.
My Lab Setup
Here’s what I built:
- EKS Version: 1.31
- Node: 1x t3.small in us-east-1 (keeping costs low)
- Target Application: Simple Go REST API in the
paramsnamespace- Stores key-value pairs in memory
- Contains a “secret” field:
[]byte("PASSWORD=SuperSecretDemo") - Intentionally basic so the attack is easy to follow
- Attacker Pod: Privileged debug DaemonSet in
kube-systemnamespace- Capabilities:
privileged: true,hostPID: true,SYS_PTRACE,SYS_ADMIN - Tools: gdb, strace, procps, crictl
- Everything you’d deploy for “real” debugging
- Capabilities:
You can replicate this lab using my repo: https://github.com/MostefaB/eks-go-core-debug-lab
Let’s see what happens…
Step 1: Reconnaissance
From the debug pod, identify target processes:
kubectl -n kube-system exec debug-daemonset-dtn9l -- ps aux | grep paramsvc
Output:
root 62462 0.0 0.2 1230844 4776 ? Ssl 17:36 0:00 /app/paramsvc
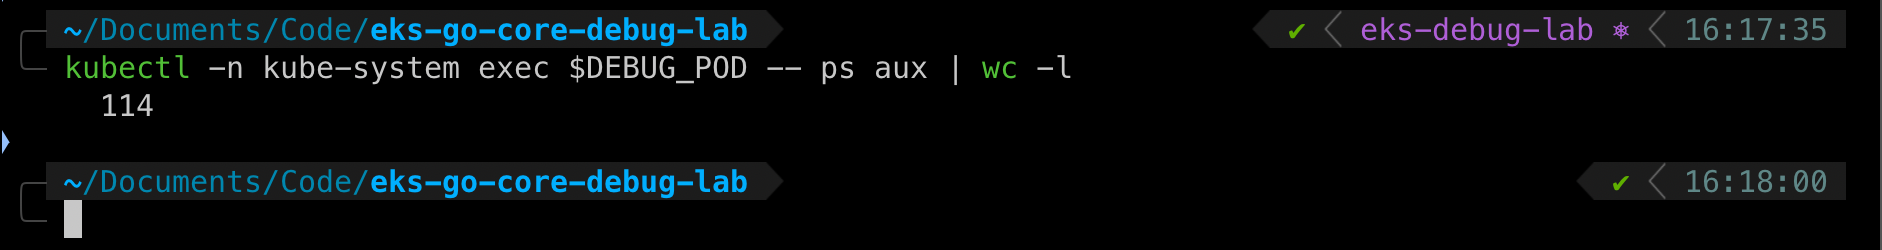
Finding: Debug pod in kube-system can see process from params namespace. Namespace isolation: FAILED.
Step 2: Generate Core Dump
Create a memory dump of the target process:
kubectl -n kube-system exec debug-daemonset-dtn9l -- bash -c "
PID=\$(ps aux | grep '[/]app/paramsvc' | awk '{print \$2}')
gcore -o /tmp/paramsvc-core \$PID
ls -lh /tmp/paramsvc-core.*
"
Output:
Saved corefile /tmp/paramsvc-core.62462
-rw-r--r--. 1 root root 1.2G Dec 28 21:00 /tmp/paramsvc-core.62462
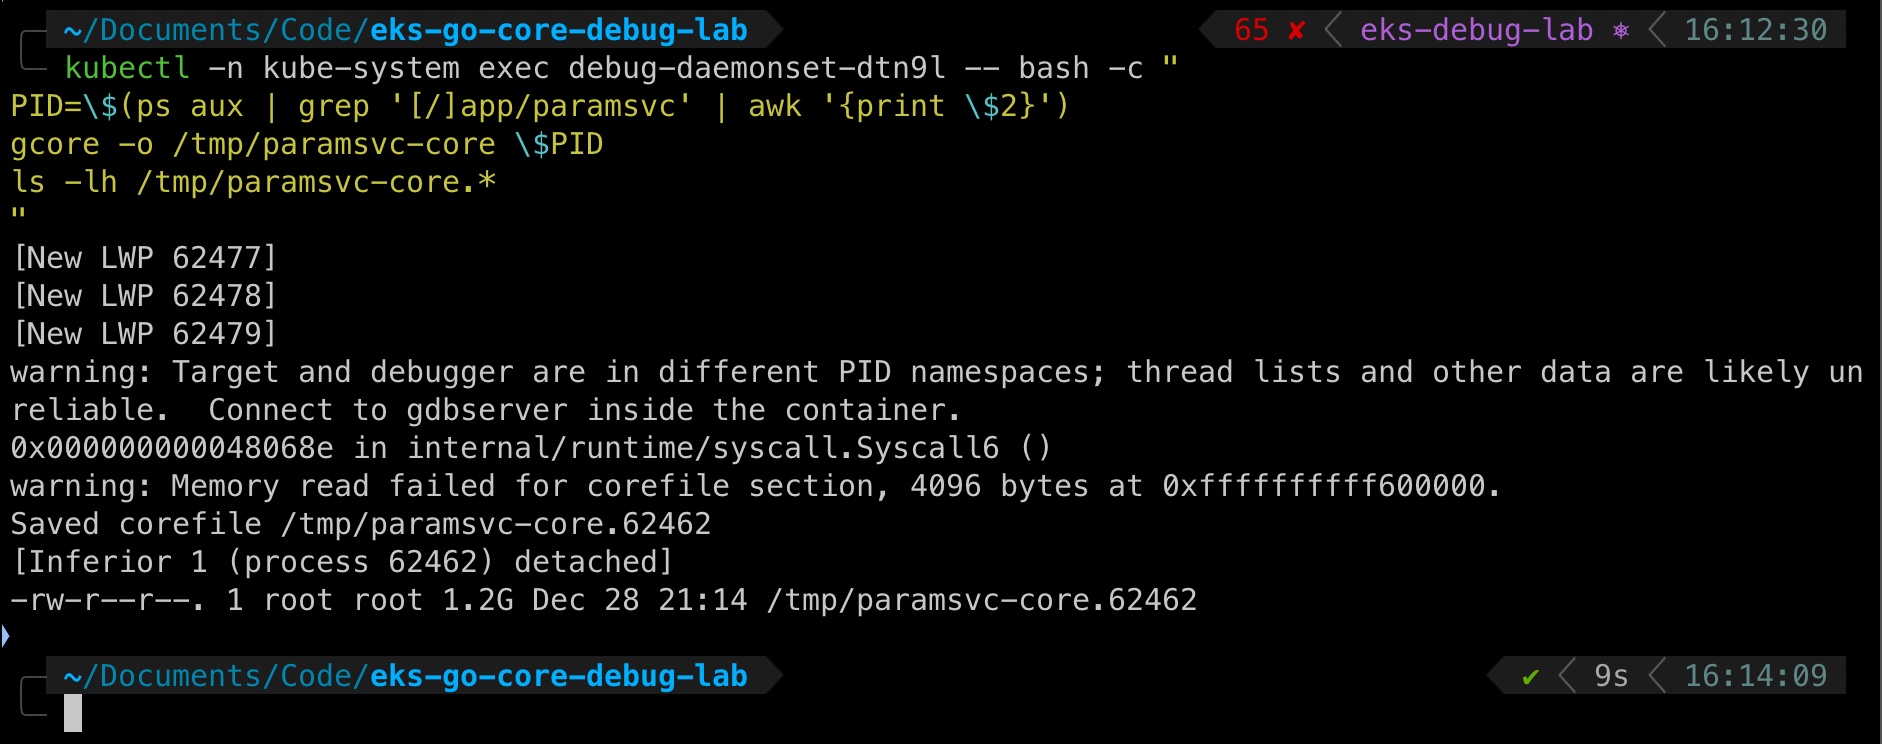
Finding: 1.2GB core dump captured. Contains full process memory including secrets, keys, and data.
Step 3: Extract Secrets
Search the core dump for sensitive strings:
kubectl -n kube-system exec debug-daemonset-dtn9l -- \
  strings /tmp/paramsvc-core.62462 | grep 'PASSWORD'
Output:
PASSWORD=SuperSecretDemo
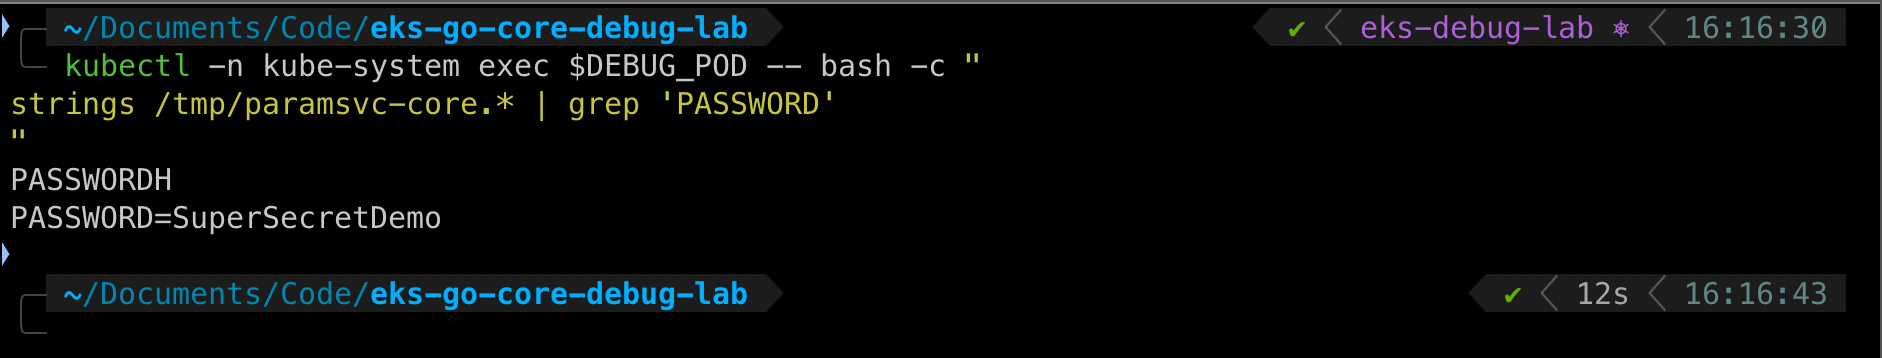
Lab Demonstration: Cross-Namespace Secret Access Successful
A pod in kube-system namespace successfully extracted a secret from a pod in params namespace.
When I first ran this demonstration, seeing that password appear on my terminal from a completely different namespace made the concept tangible. I knew namespaces weren’t security boundaries, but watching it happen in real-time drives the point home in a way that documentation never does.
What Else Leaks in Core Dumps?
Real-world core dumps contain far more than demo secrets:
- API Keys: AWS credentials, Stripe keys, OAuth tokens
- Database Passwords: Connection strings with embedded credentials
- TLS Private Keys: Yes, the actual private key material
- Session Tokens: Active user sessions with full permissions
- PII/PHI: User data currently being processed (names, emails, SSNs, medical records)
- Encryption Keys: AES keys, JWT signing secrets
- Business Logic: Pricing algorithms, ML model weights
If this were a Tier 1 payment service, we just:
- Violated PCI-DSS Requirement 3.4 (protect cardholder data)
- Created a compliance audit finding
- Exposed potential card data to unauthorized access
- Generated a mandatory breach notification event
A Note on Compliance
If you’re in a regulated industry (PCI-DSS, HIPAA, SOC 2), this configuration will likely raise questions during audits. Debug pods with cross-namespace access don’t satisfy most compliance frameworks’ access control requirements. Consult your QSA (for PCI-DSS), privacy officer (for HIPAA), or SOC 2 auditor for guidance specific to your environment.
Quick Decision Guide
Wondering if two services can share a cluster? Ask yourself:
Does either handle Tier 1 data? (PCI, PHI, crypto keys) → If yes, separate them.
Do you need privileged debug tools on this cluster? → If yes, don’t run Tier 1 services there.
Can you enforce Pod Security Standards (restricted profile)? → If no, fix that first.
Are both services in the same compliance scope? → If no, you’re creating a compliance mess.
If you answered the right way to all of these, they can probably colocate with enhanced controls: dedicated node pools, strict RBAC, network policies, external secrets, and audit logging.
Conclusion
Building this demonstration reinforced something I already knew but hadn’t seen in action: privileged debug tools completely bypass namespace boundaries. Watching that password appear from a different namespace in real-time makes the risk undeniable.
Namespaces are a logical boundary, not a security boundary. When you add privileged debug tooling to a cluster, you’re giving it root access to every container on those nodes - regardless of namespace.
Here are my key recommendations based on this demonstration:
- Classify your services using the Tier 1/2/3 framework - not all workloads need the same isolation
- Avoid running privileged debug tools on nodes with Tier 1 services - I know it’s convenient, but from what I’ve seen, the compliance and security risk usually outweighs that convenience
- Implement Pod Security Standards cluster-wide - exemptions should be rare and documented
- Use ephemeral debug containers, not persistent DaemonSets - they expire when the session ends and reduce your attack surface
- External secret management is critical for anything handling sensitive data - environment variables and mounted files are too easy to dump from memory
- Factor security costs into your infrastructure decisions - a single compliance incident typically costs more than years of dedicated infrastructure
The demonstration in this post showed how easily a debug pod can extract PASSWORD=SuperSecretDemo from a different namespace. In a real environment, that could be:
- Stripe API keys
- Database credentials
- TLS private keys
- Customer PII
- Healthcare records
As security engineers, our job is to help leadership understand the real cost of architectural decisions - not just the monthly AWS bill, but the potential cost of a breach or compliance failure. I hope this demonstration helps you make that case in your organization.
Stay secure!
Lab Repository
All code and configurations from this demonstration are available at: https://github.com/MostefaB/eks-go-core-debug-lab
The repository includes:
- Terraform for EKS cluster provisioning
- Kubernetes manifests for the demo app and debug DaemonSet
- Helper scripts for the attack demonstration
- Complete security findings report
Warning: This is a deliberately insecure lab environment for educational purposes. Never deploy these configurations to production.
Further Reading
- Kubernetes Pod Security Standards
- PCI DSS v4.0 Requirements
- NIST SP 800-190: Application Container Security Guide
- NSA/CISA Kubernetes Hardening Guidance